Excel Hypothesis Testing Guide: Unlock Statistical Insights Easily
Performing hypothesis testing in Microsoft Excel is a valuable skill for anyone in data analysis, research, or even for those looking to make data-informed decisions. This guide will walk you through the process of setting up, conducting, and interpreting hypothesis tests using Excel's built-in tools and functions, making it easier for you to unlock statistical insights from your datasets.
What is Hypothesis Testing?
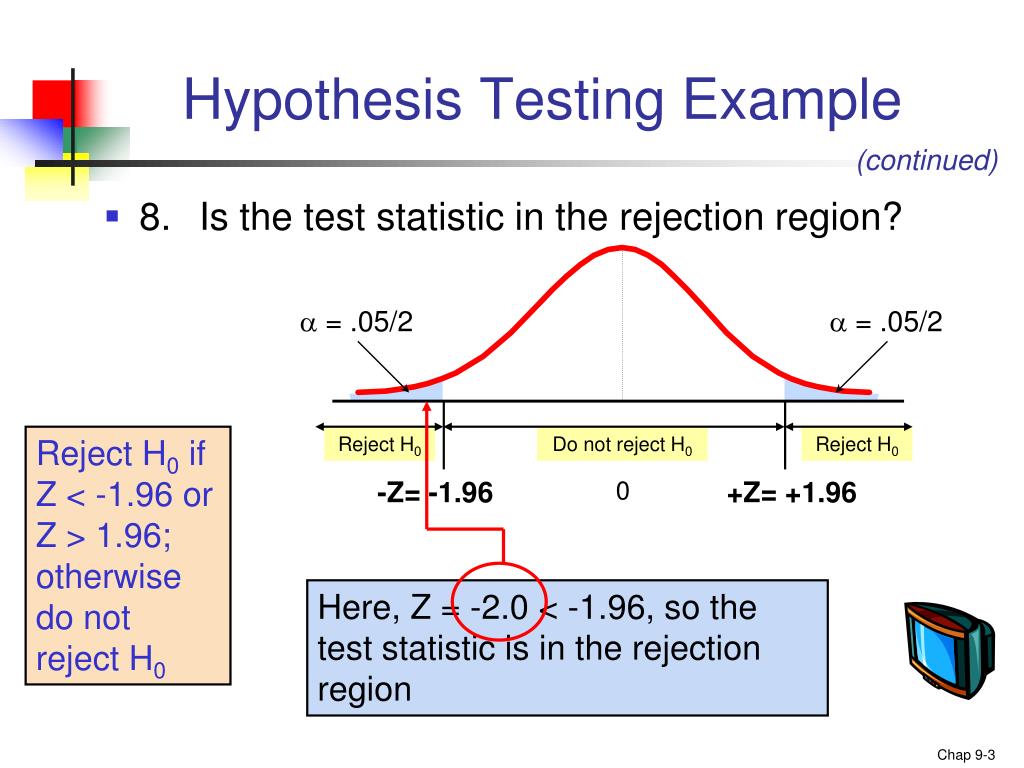
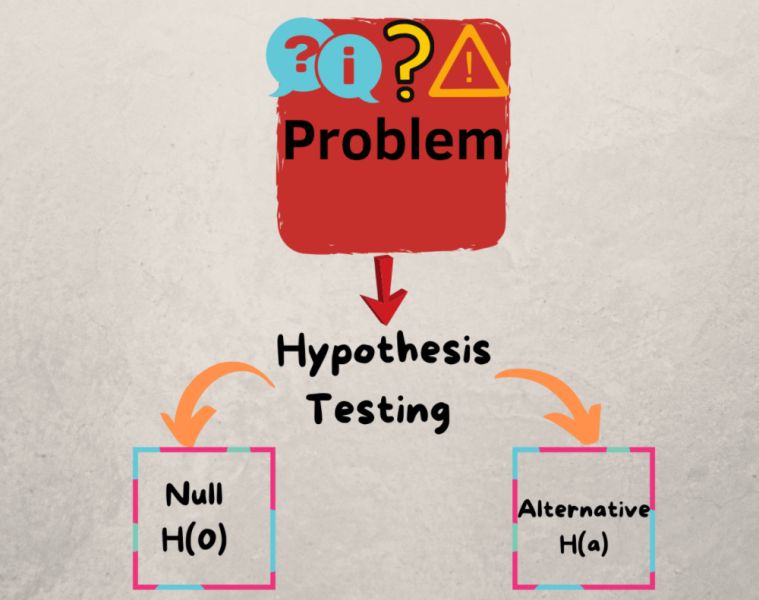
Hypothesis testing is a method used in statistics to test whether the available evidence supports a specific hypothesis about a population parameter. Here's a brief overview:
- Null Hypothesis (H0): The statement of no effect or no difference.
- Alternative Hypothesis (H1): The statement of an effect or difference.
- Test Statistic: A measure calculated from the sample to decide if the null hypothesis is unlikely to be true.
- P-value: The probability of obtaining test results at least as extreme as the observed results, under the assumption that the null hypothesis is true.
Setting Up Your Data in Excel
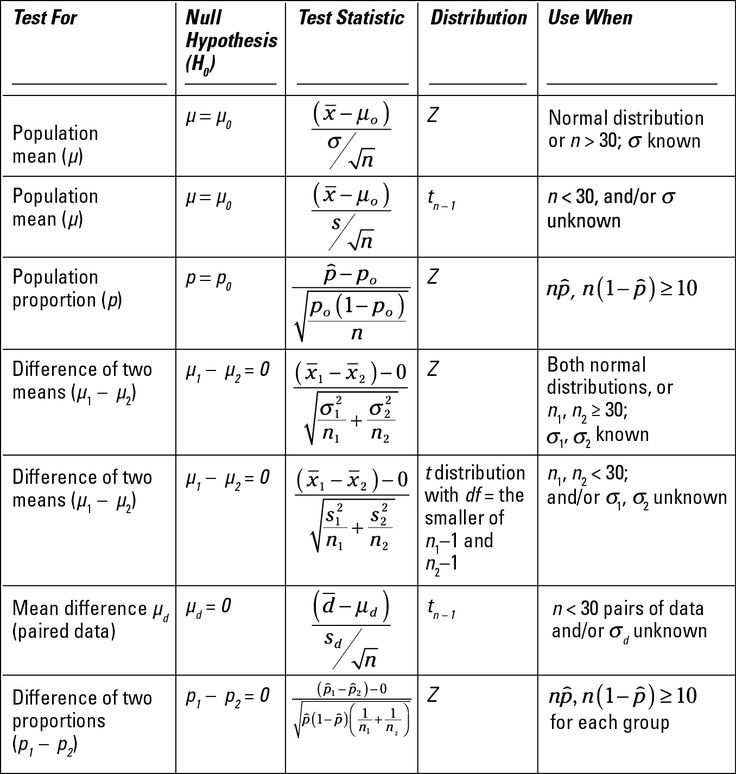
To get started with hypothesis testing in Excel, you first need to organize your data:
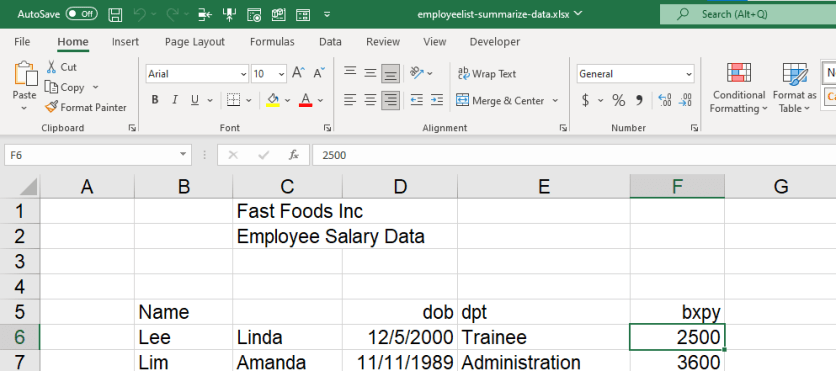
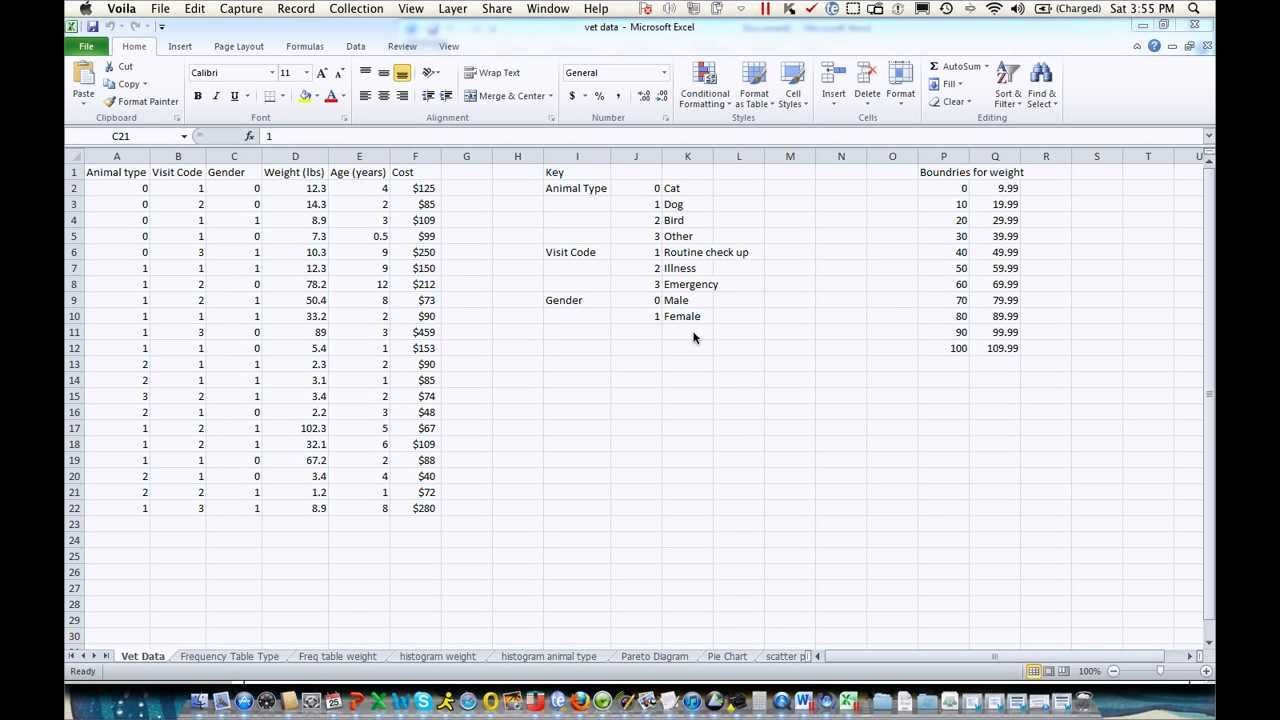
- Open Excel and enter your data into columns. For instance, if you are comparing two groups, place each group in a separate column.
- Label your columns appropriately, for example, "Group A," "Group B."
📌 Note: Ensure your data is clean; remove any outliers or irrelevant values that might skew your results.
Conducting Hypothesis Testing with Excel

Using the Data Analysis Toolpak

To perform hypothesis tests in Excel:
- Go to File > Options > Add-Ins.
- In the Manage box, select Excel Add-ins and click Go.
- Check the box next to Analysis ToolPak, then click OK.
- Now, you can access various statistical tools from the Data tab under Data Analysis.
To conduct a t-test for comparing means:
- Select Data Analysis.
- Choose t-Test: Two-Sample Assuming Equal Variances (or unequal if appropriate).
- In the dialog box, input the range for both groups, the Hypothesized Mean Difference, and the desired alpha level (usually 0.05 for a 5% significance level).
📌 Note: The choice between assuming equal or unequal variances depends on your understanding of your data's variability. If unsure, perform both tests and compare results.
Interpreting Results
After running the t-test:
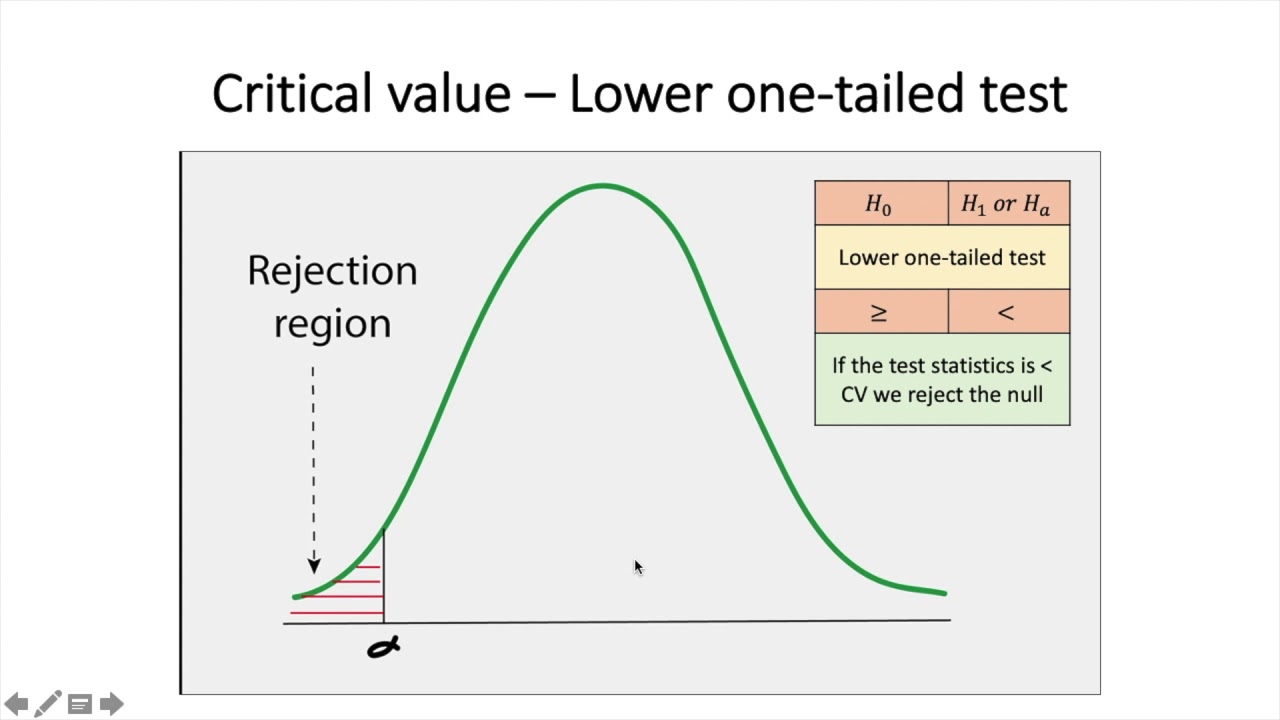
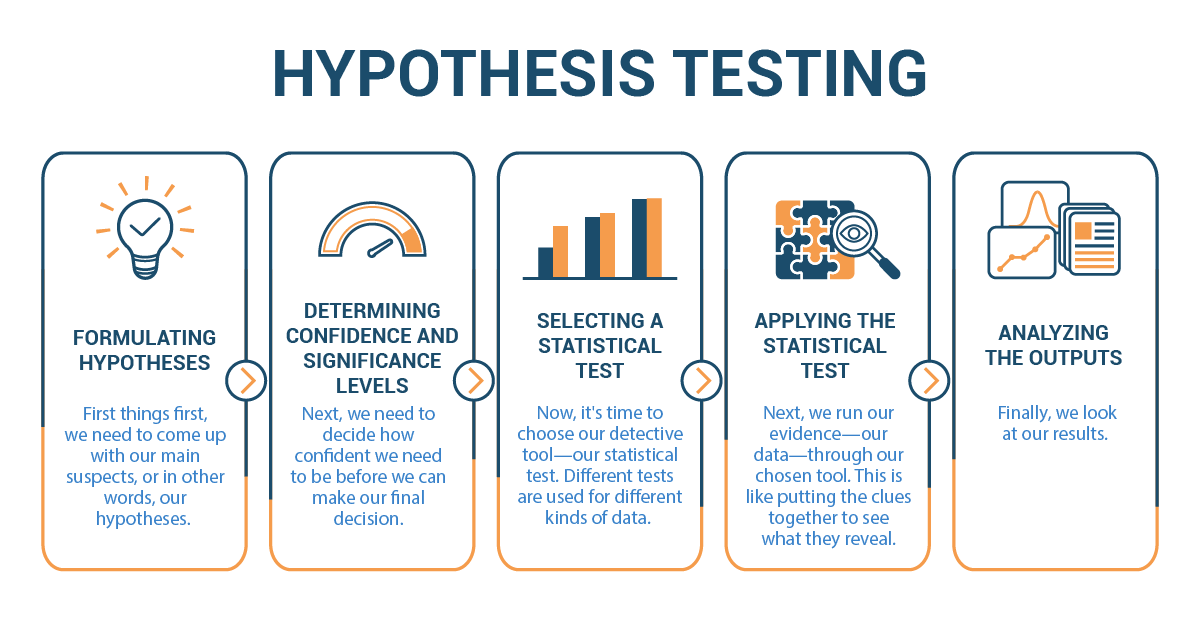
- Review the P-value: If the p-value is less than the alpha level, reject the null hypothesis. This suggests a statistically significant difference between groups.
- Look at the t-statistic to understand how different the groups are.
- Check the Confidence Interval to see the range of plausible values for the true difference between groups.
Advanced Hypothesis Testing in Excel
For more complex analyses, you might want to consider:
- ANOVA: When comparing more than two groups, use ANOVA: Single Factor under Data Analysis.
- Chi-square Test: For categorical data, use Chi-Square Test.
- Regression Analysis: If looking to explore relationships between variables, use Regression.
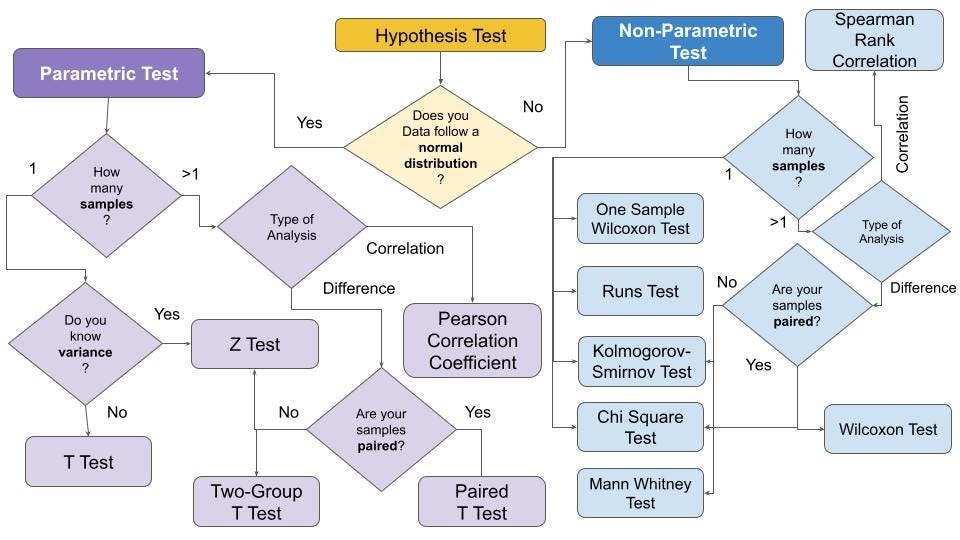
Table: Tools for Different Tests in Excel
| Test | Tool | Use |
|---|---|---|
| t-Test | Data Analysis > t-Test | Mean difference between two groups |
| ANOVA | Data Analysis > ANOVA | Mean differences among multiple groups |
| Chi-square | Data Analysis > Chi-Square | Categorical data analysis |
| Regression | Data Analysis > Regression | Relationship between variables |
📌 Note: Always verify your results with another statistical software or manual calculations for important decisions.
By mastering hypothesis testing in Excel, you empower yourself to make informed decisions based on data-driven insights. Excel's user-friendly interface makes it an accessible tool for both novice and seasoned data analysts to perform complex statistical analyses without the need for specialized statistical software. Remember, the key to effective hypothesis testing is not just running the tests but interpreting the results in the context of your research question or business problem.
What is the significance level?
+
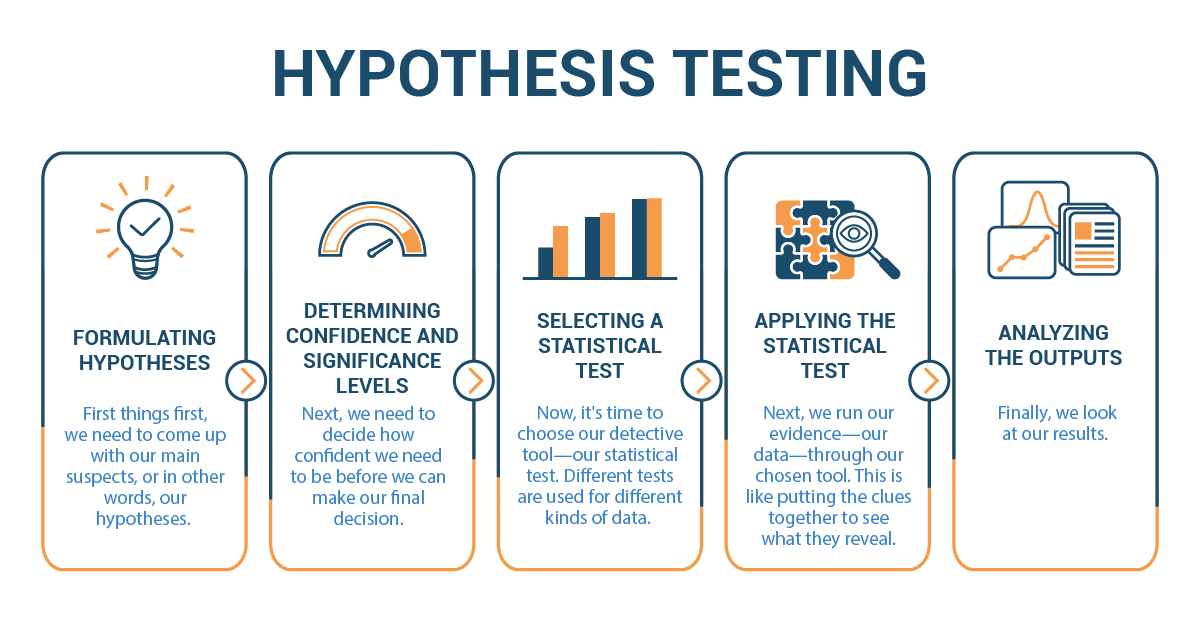
The significance level (alpha) is the threshold for rejecting the null hypothesis. Common values are 0.05 or 0.01, meaning if the p-value is less than this value, the null hypothesis is rejected at that level of significance.
Can I perform a one-sided t-test in Excel?

+
Yes, but Excel’s Data Analysis tool only offers a two-sided t-test. For a one-sided test, you would need to adjust the p-value or use manual calculation.
What does a small p-value indicate in hypothesis testing?
+
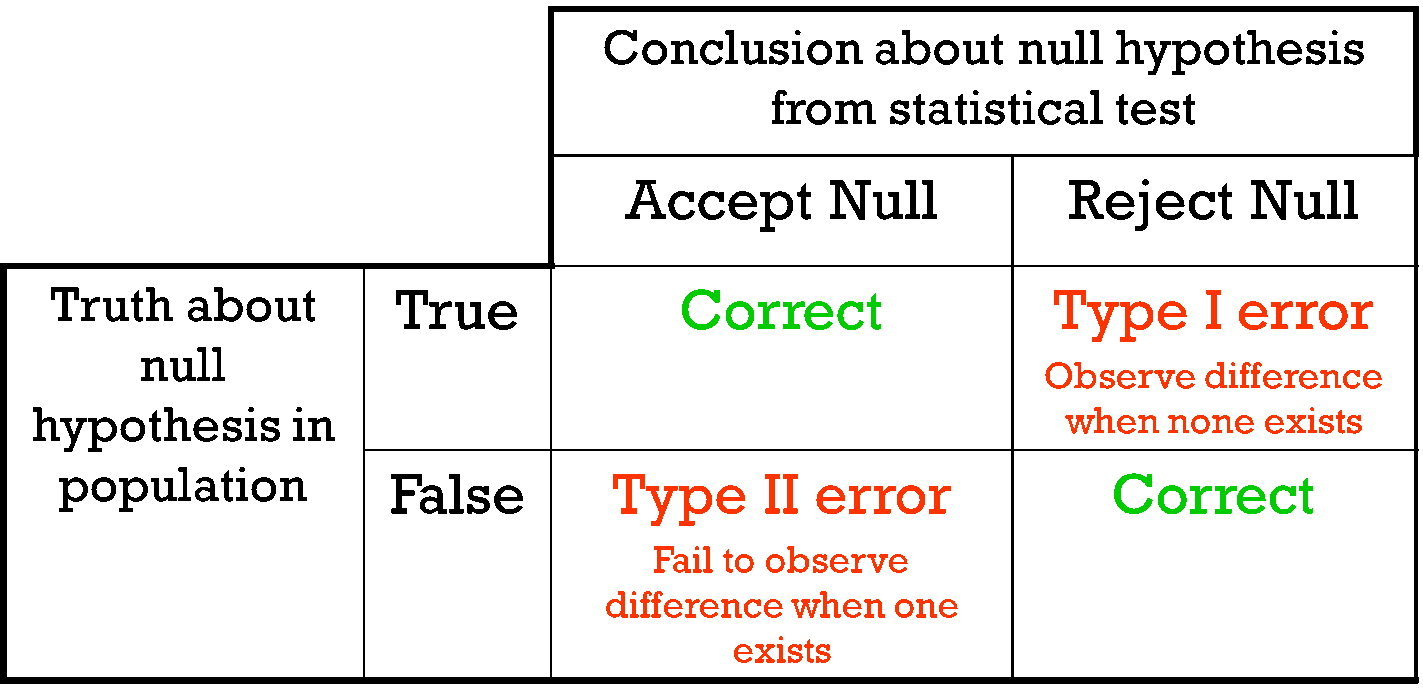
A small p-value (typically less than 0.05) indicates that the observed data is unlikely under the null hypothesis, suggesting that the null hypothesis might not be true.
