How To Calculate P Value Using Excel

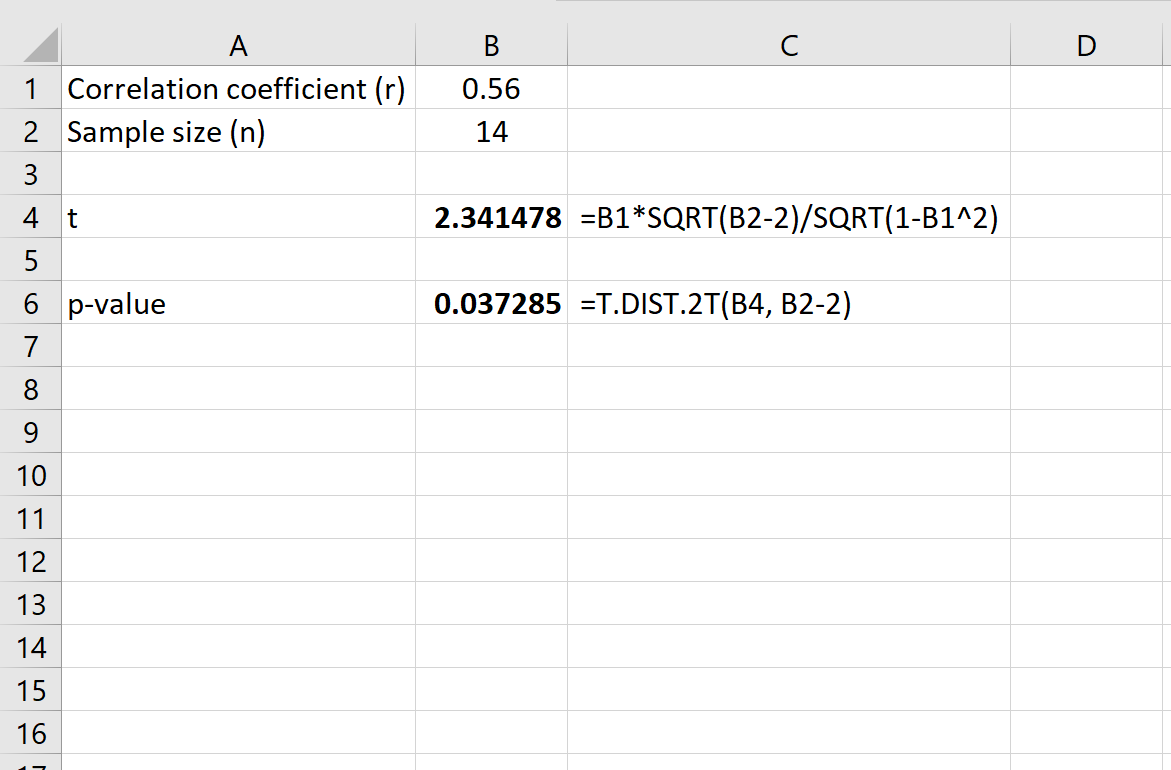
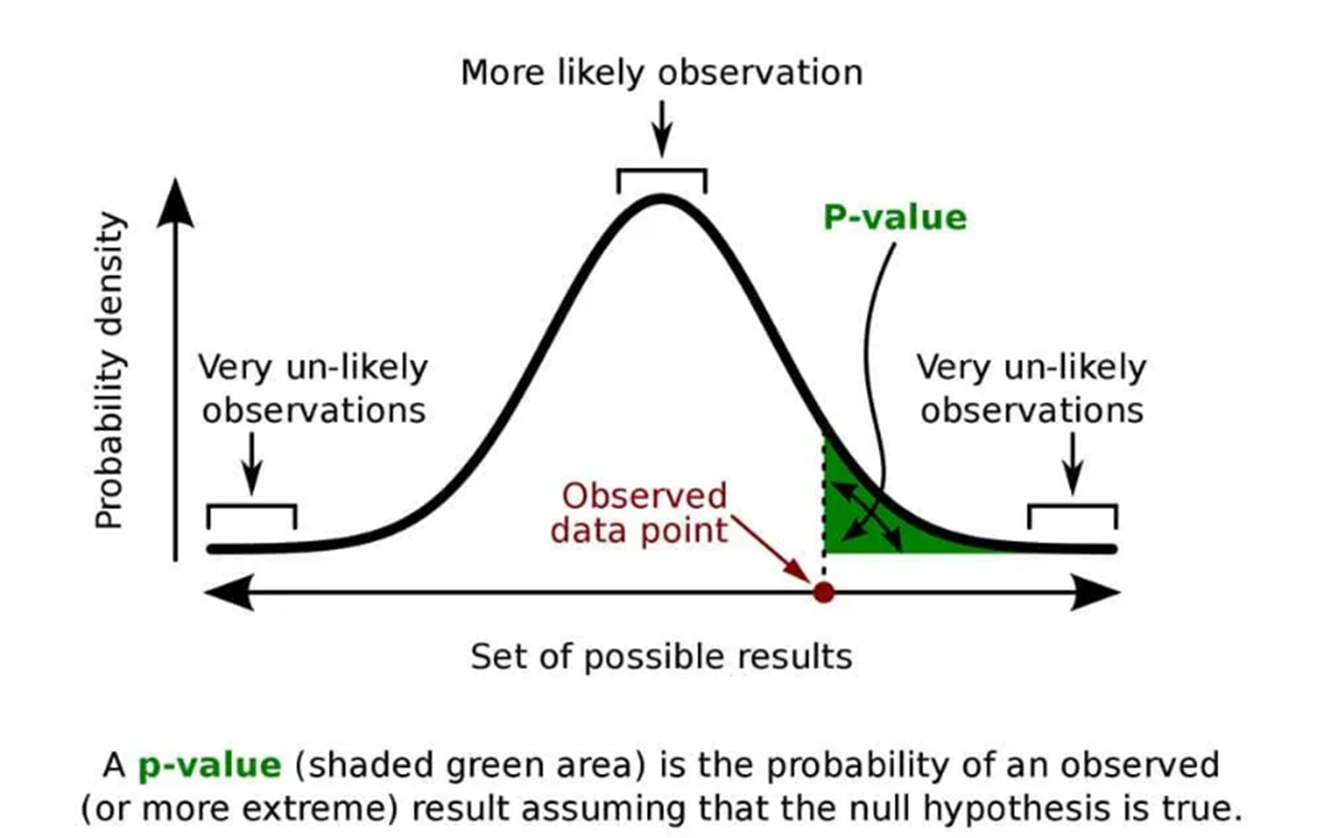
The p-value is a crucial statistical tool that tells us the probability of obtaining results as extreme or more extreme than those observed, assuming the null hypothesis is true. In the field of statistical analysis, this value helps researchers to either reject or fail to reject the null hypothesis based on the results of a given test. Excel, a versatile tool commonly used for data analysis, offers functionalities to compute p-values for various statistical tests through its built-in functions and formulas. This guide will walk you through how to calculate p-values in Excel for common tests like the t-test, chi-square test, and ANOVA.
Understanding P-Value
Before diving into the calculations, let’s briefly understand what a p-value signifies:
- Null Hypothesis (H0): This is the hypothesis that there is no effect or no difference. For example, there is no difference between two groups.
- Alternative Hypothesis (H1): This hypothesizes that there is an effect or a difference.
- P-value: It measures the evidence against the null hypothesis. If the p-value is less than your chosen significance level (commonly 0.05), you reject the null hypothesis.
💡 Note: Smaller p-values indicate stronger evidence against the null hypothesis.
Calculate P-Value for T-Test in Excel
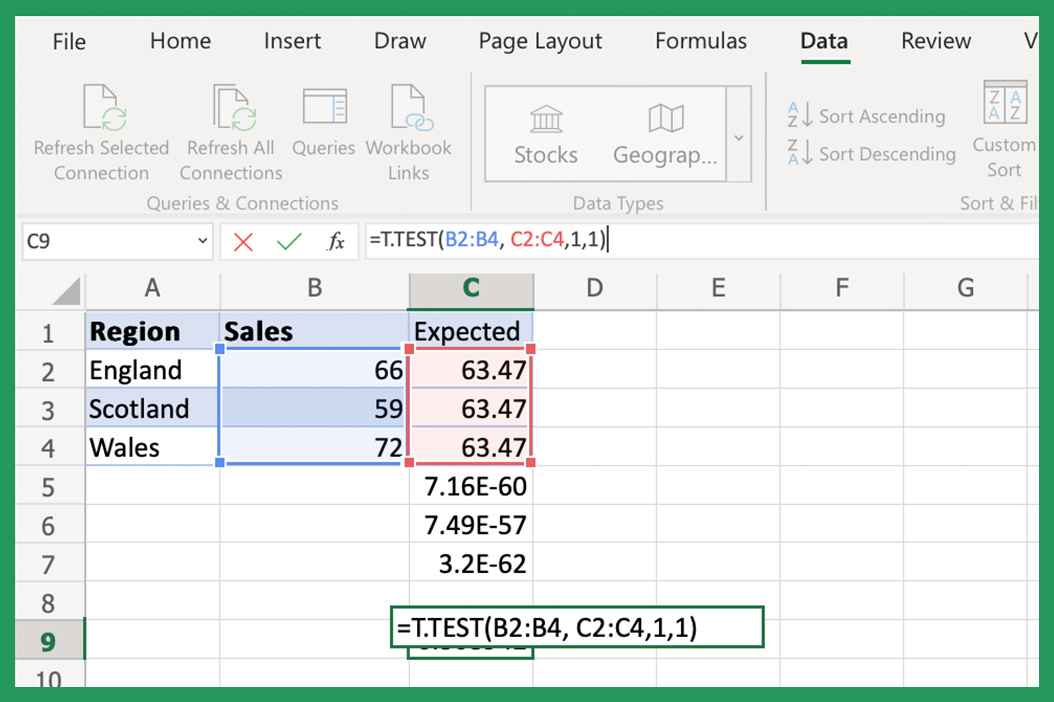
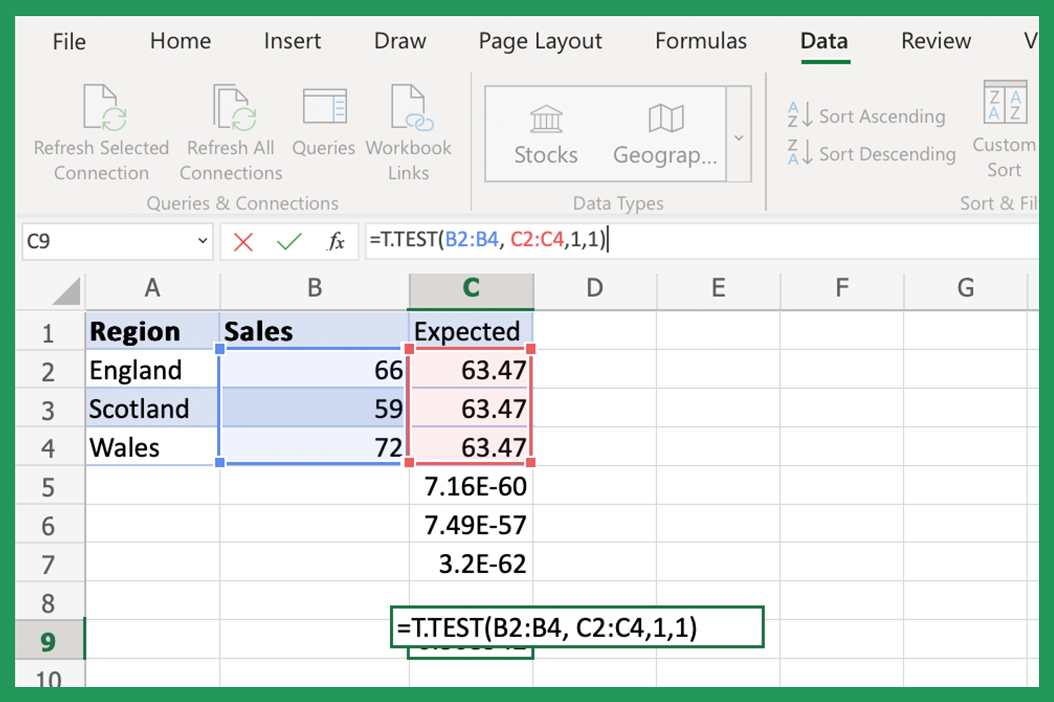
The t-test is used to determine if there’s a significant difference between the means of two groups. Here’s how to calculate the p-value for a two-sample t-test in Excel:
- Data Preparation: Organize your data into two columns with each row representing a single observation.
- Perform T-Test:
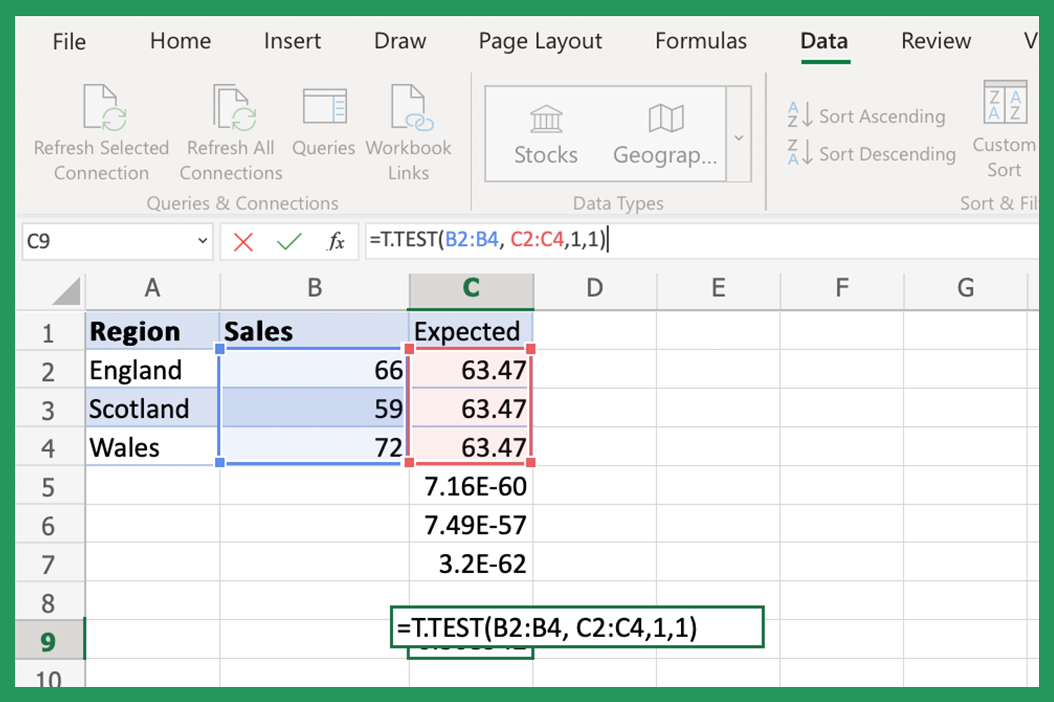
= T.TEST(array1, array2, tails, type)
- array1: The range containing the first sample.
- array2: The range containing the second sample.
- tails: Enter 1 for a one-tailed test or 2 for a two-tailed test.
- type: Type of t-test:
- 1: Paired
- 2: Two-sample equal variance
- 3: Two-sample unequal variance
- Interpret Results: Excel will return the p-value. If this value is less than your significance level, you can reject the null hypothesis.
| T-Test Type | When to Use |
|---|---|
| Paired | For comparing two sets of related data. |
| Two-sample equal variance | When comparing two groups with the same variance. |
| Two-sample unequal variance | When comparing two groups with potentially different variances. |

Calculate P-Value for Chi-Square Test
The Chi-Square test is used to determine if there is a significant association between categorical variables. Here’s how to perform the Chi-Square test in Excel:
- Data Entry: Enter observed frequencies into a table with categories as rows and columns.
- Calculate Expected Frequencies: Using the formula:
= (row total * column total) / grand total - Chi-Square Calculation: Use this formula to find the Chi-Square statistic:
= CHISQ.TEST(actual_range, expected_range) - Find P-Value: Use Excel’s function to compute the p-value:
= CHISQ.DIST.RT(chi_square_value, degrees_of_freedom)Where degrees of freedom is (number of rows - 1) * (number of columns - 1). - Interpret: If the p-value is below your significance level, the association is considered statistically significant.
Calculate P-Value for ANOVA in Excel

Analysis of Variance (ANOVA) is used to compare means across more than two groups. Here’s how to do it:
- Data Setup: Enter your data into columns, one for each group.
- ANOVA Calculation: Use the following steps:
- Go to Data > Data Analysis (if not visible, enable it from Excel Options).
- Select “Anova: Single Factor”.
- Input your data range and choose the alpha level for your test.
- Click OK to generate the ANOVA table.
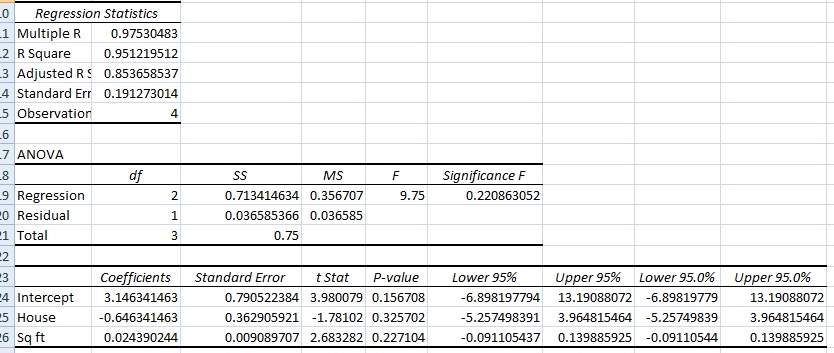
- Finding P-Value: Look for the ‘p-value’ or ‘Significance F’ in the ANOVA table. If this value is less than your chosen significance level, you can reject the null hypothesis, suggesting a difference between groups.
⚠️ Note: If Data Analysis isn't available, ensure to install the Analysis Toolpak add-in.
Final Thoughts

Calculating p-values in Excel allows researchers and analysts to make informed decisions based on data. Whether it’s comparing means, testing associations, or examining differences across multiple groups, Excel provides robust tools to perform these calculations. Remember, the interpretation of p-values requires an understanding of the context, the hypothesis being tested, and the chosen significance level. With practice, you’ll be able to use Excel to confidently analyze data and make statistically sound conclusions.
What if my p-value is exactly equal to my significance level?
+
If your p-value is equal to your significance level (e.g., 0.05), the result is borderline significant. It’s good practice to report this situation accurately, and you might consider examining your data further or collecting more data to achieve a more decisive conclusion.
Can I use Excel for more complex statistical tests?
+
Excel provides basic to intermediate statistical functions but might not support all complex analyses. For more sophisticated statistical tests, consider using specialized statistical software like R or SPSS.
How do I choose between one-tailed and two-tailed tests?
+
Choose a one-tailed test if you’re specifically looking for an effect in one direction (e.g., increase or decrease). Use a two-tailed test if you’re looking for any difference between groups, regardless of direction.

