3 Easy Steps to Calculate Z-Score in Excel
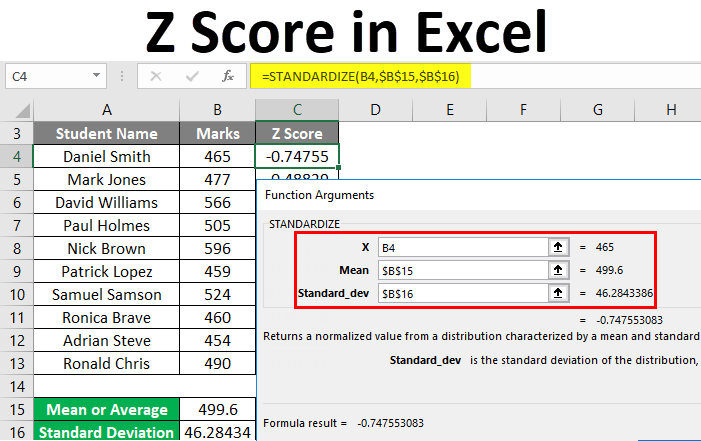
Understanding how to calculate the Z-score can be crucial in various fields such as statistics, finance, and psychology, to name a few. Whether you're trying to measure how many standard deviations an element is from the mean, assessing the probability of a specific value in a normal distribution, or just delving into data analysis, the Z-score is your go-to metric. In this blog post, we'll demystify how you can quickly calculate the Z-score using Microsoft Excel, one of the most common tools for statistical computations.
What is a Z-Score?
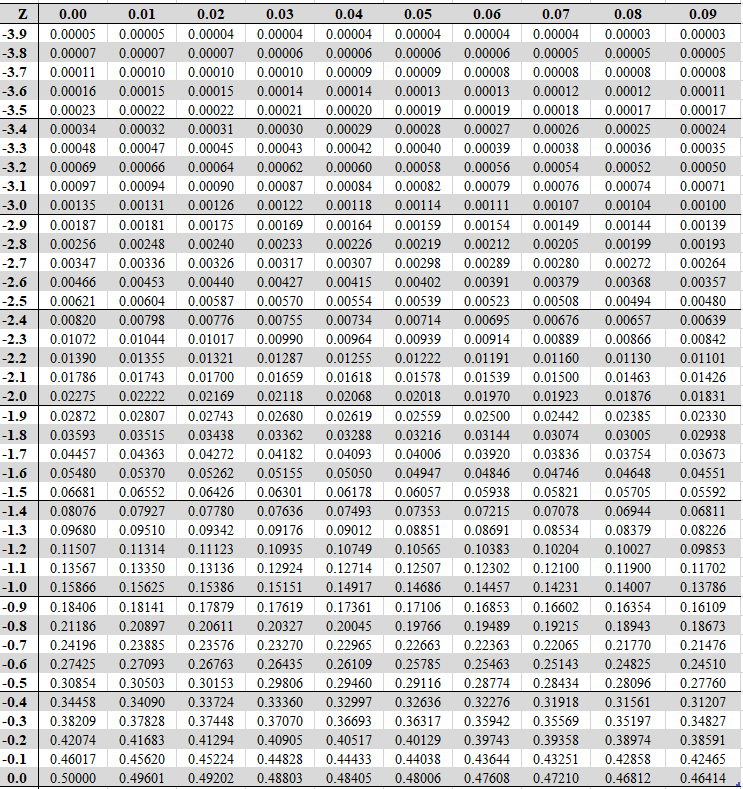
Before diving into the calculation, let's define what a Z-score is. A Z-score, sometimes called a standard score, represents the number of standard deviations a data point is from the mean of a set of data. Here's the formula:
Z = (X - μ) / σ
- X: The value you want to evaluate.
- μ: The mean (average) of the dataset.
- σ: The standard deviation of the dataset.
📌 Note: For a normal distribution, Z-scores help to understand how unusual or common a given data point is within the set.
Step-by-Step Guide to Calculate Z-Score in Excel
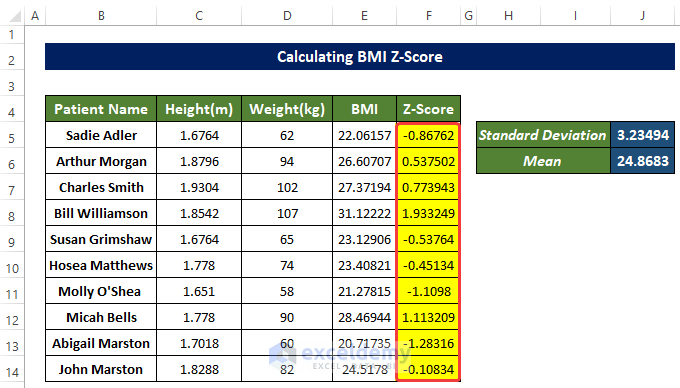
Step 1: Prepare Your Data
The first step involves having your data ready in Excel:
- Input your dataset into a column or row. Let’s say your data is in
A2:A100. - You’ll also need cells to calculate the mean and standard deviation.
Step 2: Calculate the Mean and Standard Deviation

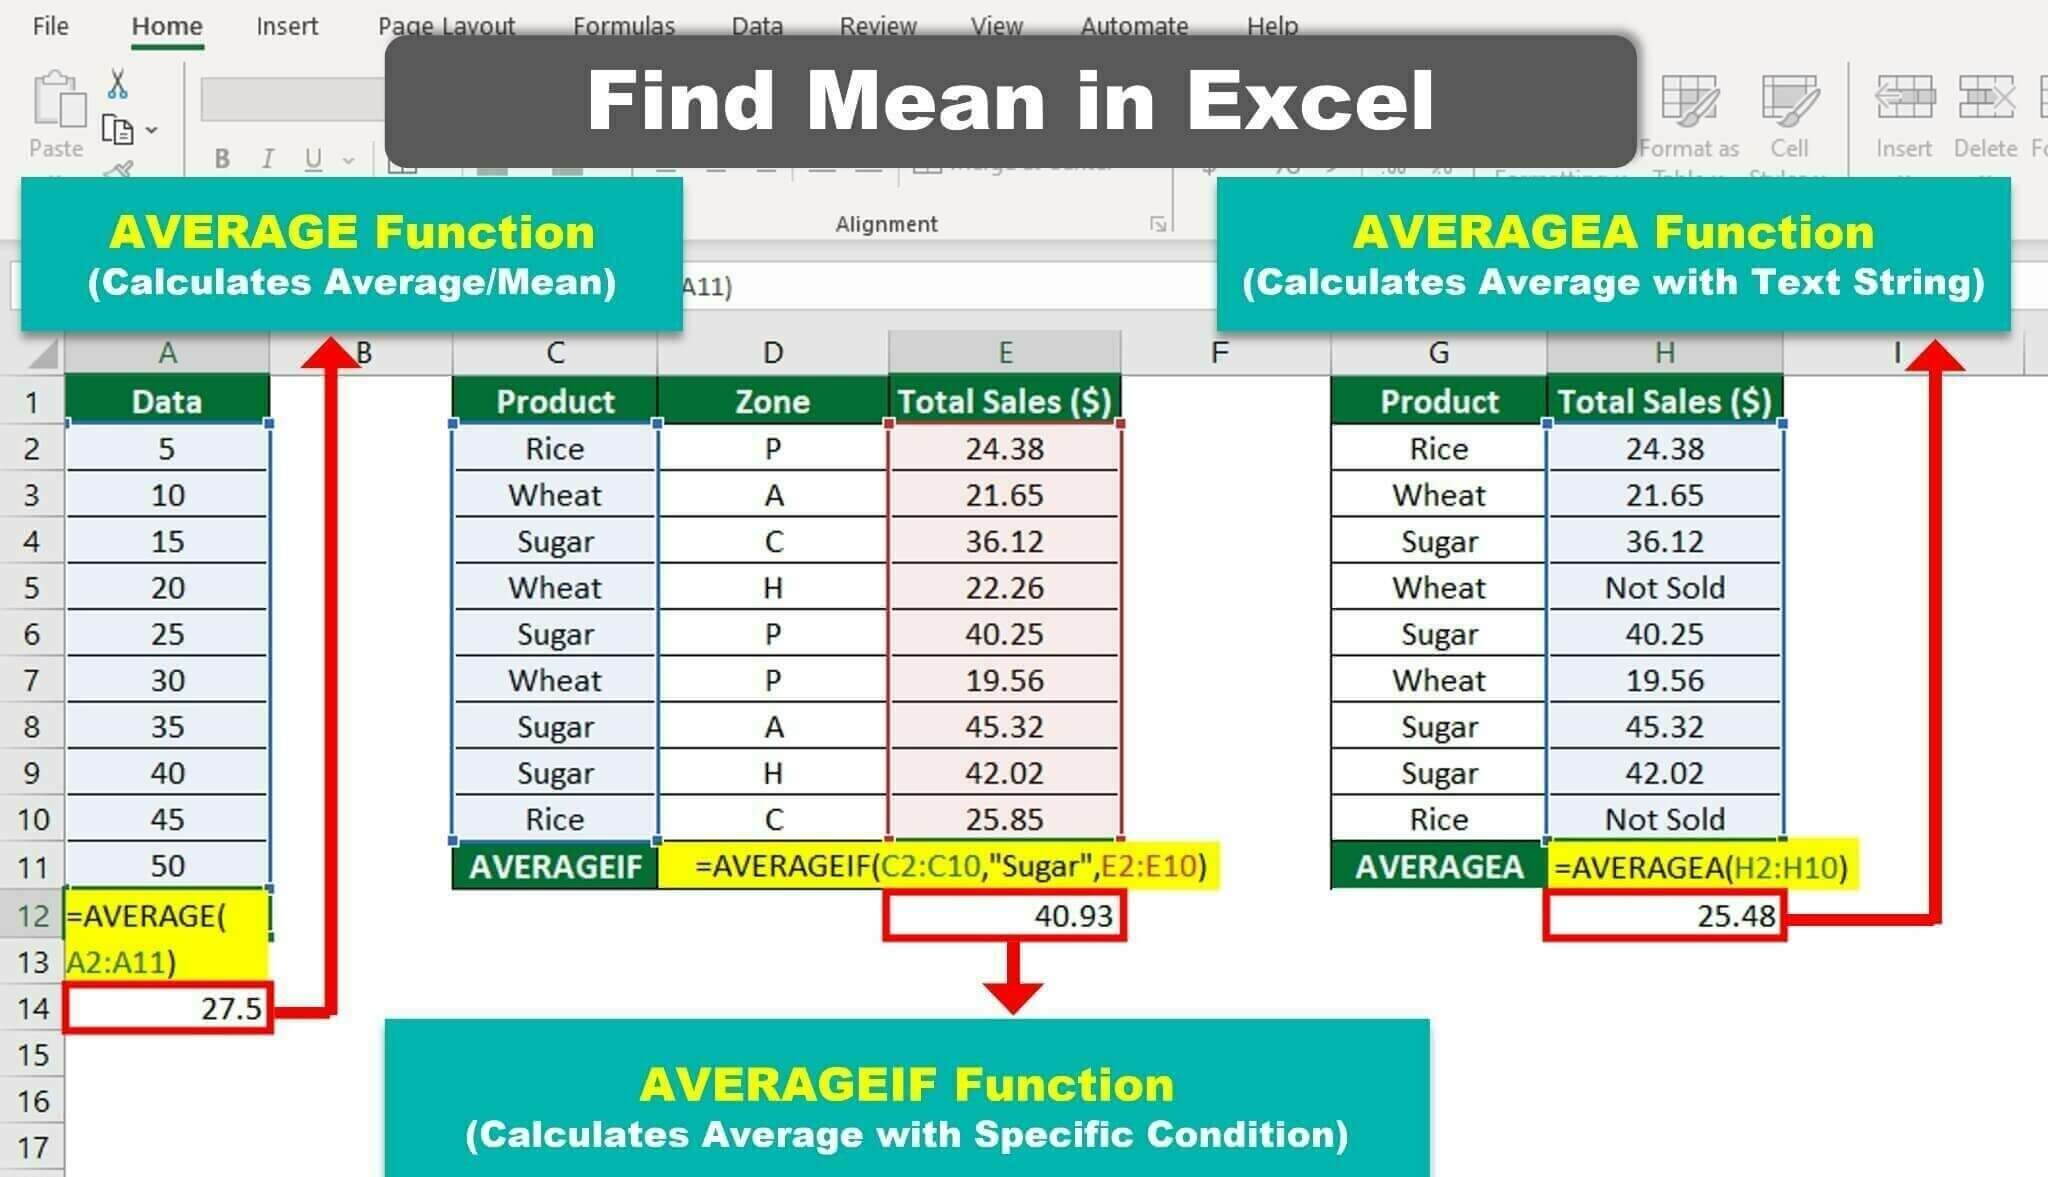
Using Excel’s built-in functions, you can easily compute these:
- Mean: Use the
AVERAGEfunction. Suppose you want to calculate the mean of the data inA2:A100, you would type: - Standard Deviation: Use the
STDEV.P(for the population) orSTDEV.S(for a sample) function:
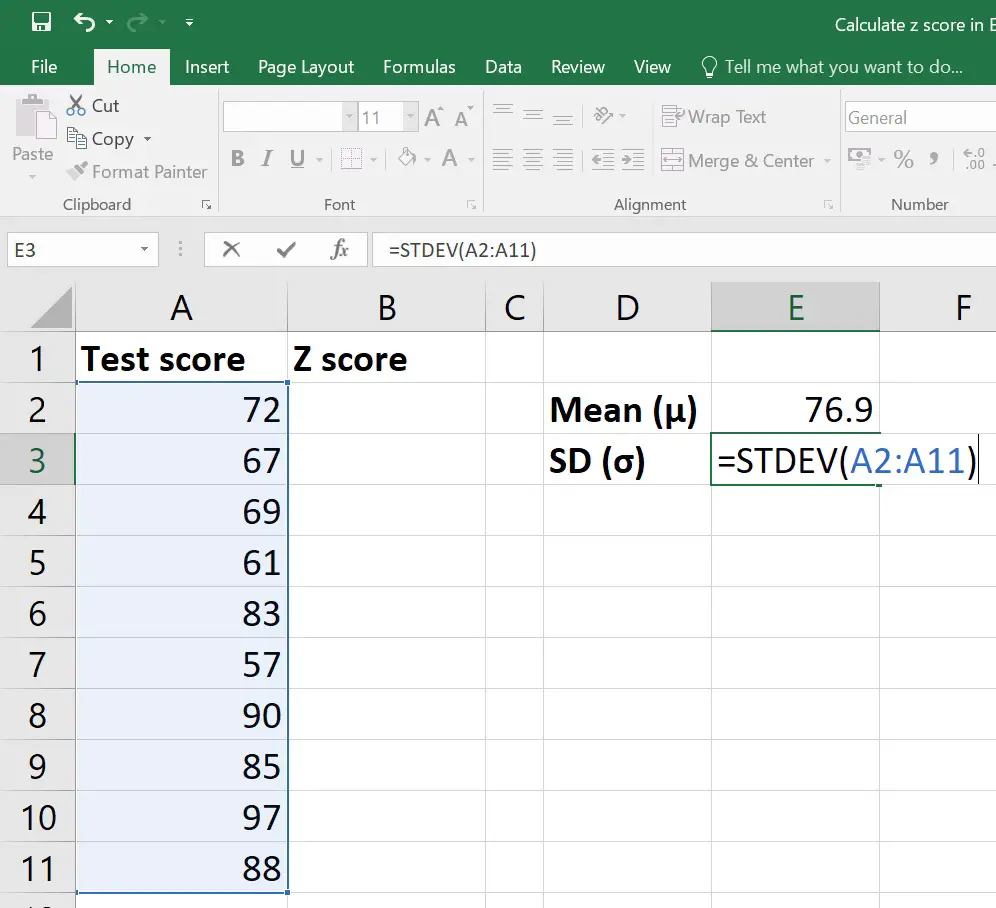
=AVERAGE(A2:A100) in say, cell B2.
=STDEV.P(A2:A100) or =STDEV.S(A2:A100) in cell B3 for example.
📌 Note: Choose STDEV.S if your data represents a sample from a larger population, otherwise use STDEV.P for the entire population.
Step 3: Calculate the Z-Score

Now, with the mean and standard deviation calculated, you can find the Z-score for each value:
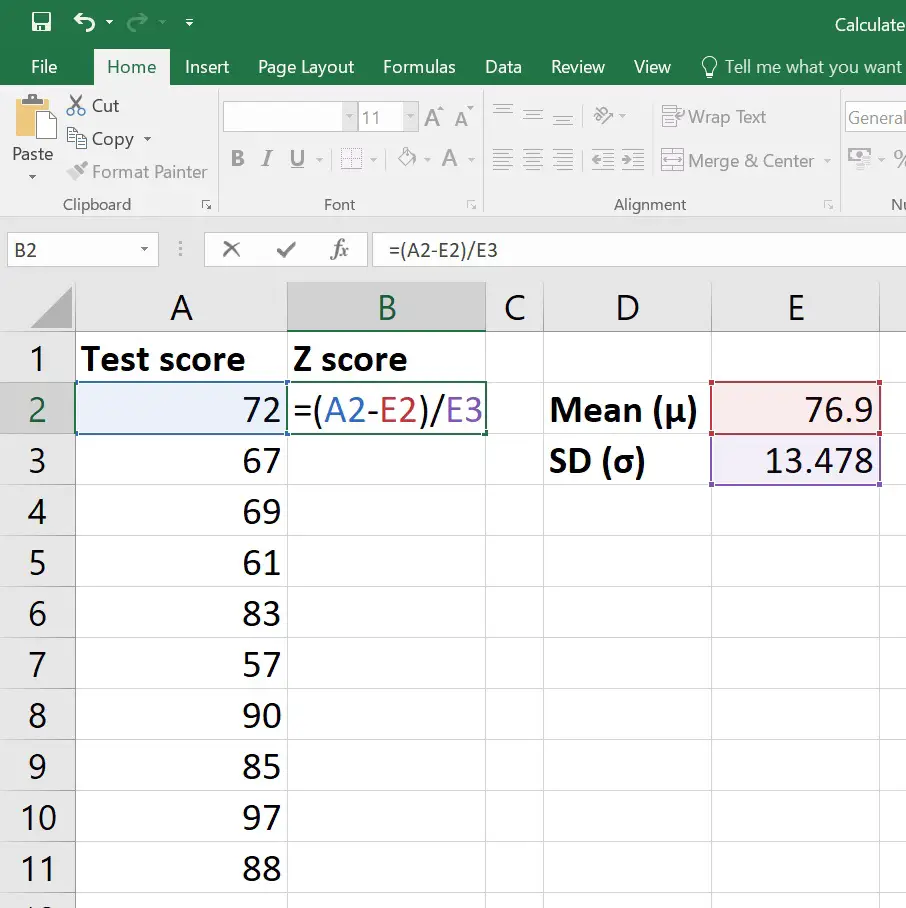
- Let's say you want to calculate the Z-score for the value in cell
A2. In cellB4, you would enter:
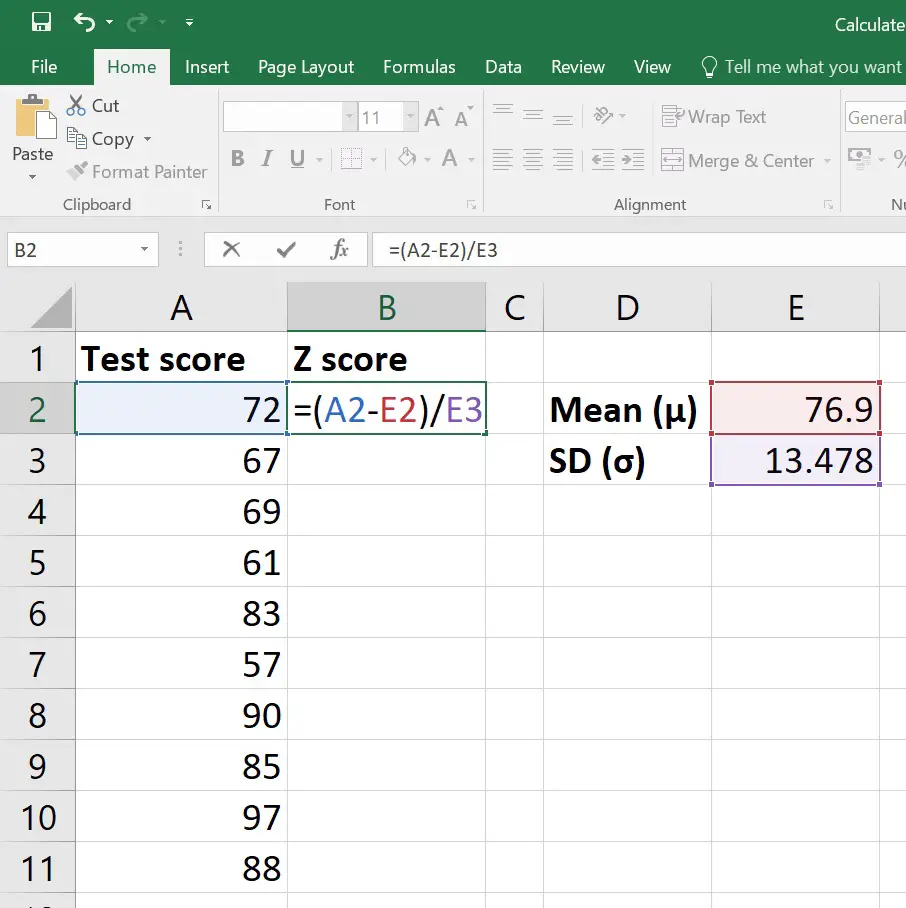
=(A2-$B$2)/$B$3
This formula subtracts the mean from the value in A2 and divides by the standard deviation. You'll need to lock the references for mean and standard deviation with absolute references ($) so that when you drag the formula down, it applies to each row's value.
If you want to calculate Z-scores for multiple values, you can copy the formula from B4 down the column alongside your dataset.
Notes:

📌 Note: To calculate Z-scores for a set of values, simply extend the formula to cover the entire range of your dataset.
📌 Note: Excel uses a positive Z-score to indicate values above the mean and a negative Z-score for values below the mean.
📌 Note: If your dataset has missing values or errors, Excel might return #DIV/0! or #VALUE!. Ensure to clean or handle such data appropriately.
By following these three straightforward steps, you’ve now learned how to calculate Z-scores in Excel, which can be a powerful tool in data analysis, allowing you to interpret and compare values across different data sets and distributions.
The importance of understanding Z-scores goes beyond mere calculation; it’s about interpreting data in a meaningful way. From identifying outliers to standardizing scores for comparison, Z-scores provide a robust statistical tool to gain insights into your data. Remember, with Excel’s computational prowess, you can efficiently handle large datasets and derive valuable statistical insights with ease.
What is the difference between STDEV.S and STDEV.P in Excel?
+
STDEV.S calculates the standard deviation based on a sample, whereas STDEV.P assumes the dataset represents the entire population. Use STDEV.S when you have a sample from a larger population, and use STDEV.P when you’re dealing with the entire population of data.
How can I interpret Z-scores?
+
A Z-score of 0 means the value is equal to the mean. A positive Z-score indicates the value is above the mean, while a negative Z-score shows it’s below the mean. Larger absolute values of Z-scores suggest the data point is further from the mean, making it more unusual or extreme.
Can Z-scores be used for non-normal distributions?
+
Technically, Z-scores are derived from the normal distribution, but they can still be calculated and provide useful information for any distribution. However, the interpretation might not follow the same probabilistic framework as with normally distributed data.
