5 Ways to Calculate Slope Uncertainty in Excel
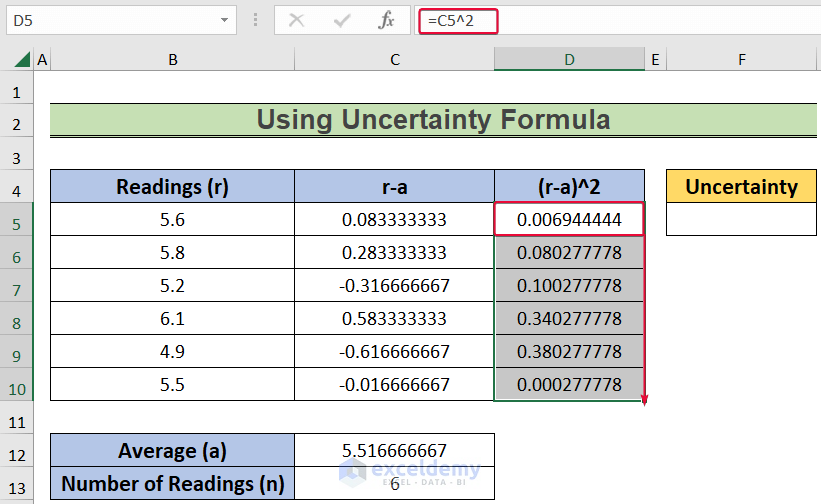
Excel isn't just a tool for creating spreadsheets and charts; it's also incredibly useful for performing statistical analyses, including calculating uncertainties in measurements. One common application in various fields like engineering, physics, and data science is to calculate the uncertainty of the slope in a linear regression model. Here are five methodologies to help you manage and calculate slope uncertainty in Excel.
1. Standard Error of the Regression Coefficient
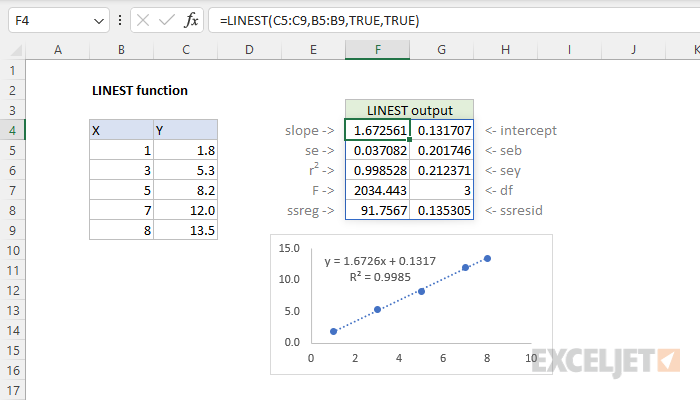
The most straightforward method to calculate slope uncertainty is by using Excel’s LINEST function. This function gives the statistical outputs for a linear regression analysis:
- y = mx + b
Where ’m’ is the slope, ‘b’ is the y-intercept, ‘x’ is the independent variable, and ‘y’ is the dependent variable.
To use LINEST:
- Select a 2-row by 5-column range in your worksheet
- Type
=LINEST(y_range, x_range, TRUE, TRUE)and press Ctrl + Shift + Enter to perform an array formula.
The first column of this array will include the slope (m) and its standard error, providing you with immediate insights into the slope uncertainty.
2. Bootstrap Method

Bootstrapping is a powerful non-parametric statistical technique to estimate the sampling distribution of an estimator by resampling with replacement from the original dataset. Here’s how you can apply it in Excel:
- Copy your x and y data to create several “new” datasets by sampling with replacement.
- For each dataset, calculate the slope using the
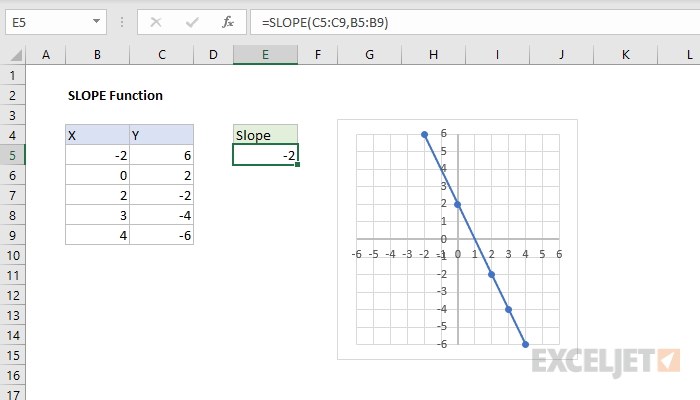
SLOPEfunction or LINEST. - Compute the mean and standard deviation of the slopes obtained from these datasets.
The standard deviation provides an estimate of the slope uncertainty:
=STDEV.S(Bootstrap_Slope_Range)
3. Monte Carlo Simulation
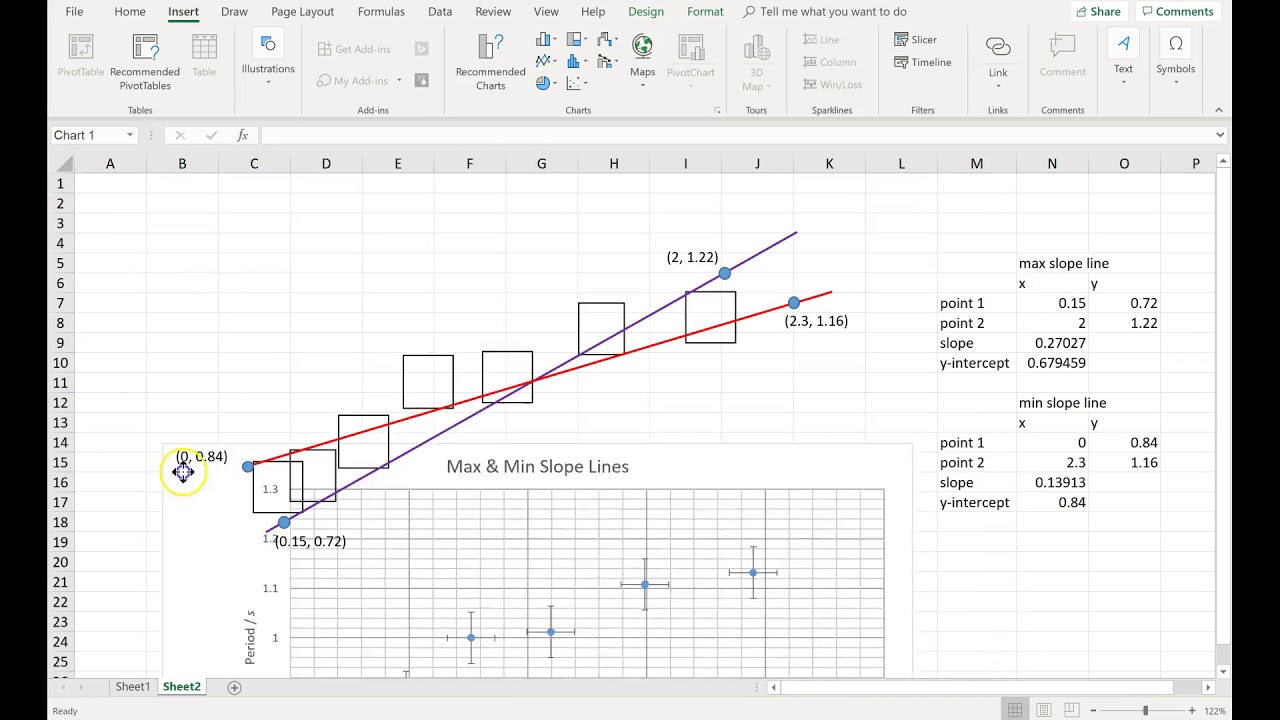
This method involves generating random perturbations around your data points and then calculating slopes for these new sets of data:
- Generate normally distributed random numbers for both x and y values.
- Add these random numbers to your original data to simulate measurement error.
- Calculate the slope for each simulated dataset.
- The standard deviation of these slopes gives you the uncertainty.
Monte Carlo simulations can be easily set up using Excel’s random number generation functions combined with basic arithmetic operations.
4. Propagation of Errors
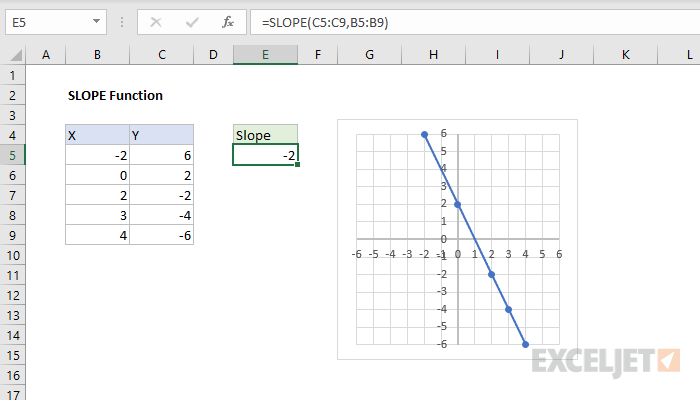
This method uses the concept of error propagation to calculate the uncertainty in the slope when both x and y measurements have their own uncertainties:
Let ( \Delta x ) and ( \Delta y ) be the uncertainties in x and y, respectively. The uncertainty in the slope, ( \Delta m ), can be derived as:
🔧 Note: This method assumes normal distribution in errors.
| Term | Formula |
|---|---|
| \[ \Delta m \] | \[ \sqrt{ \frac{\Delta y^2}{\sum (x_i - \bar{x})^2} + \Delta x^2 \left( \frac{\sum y_i}{\sum (x_i - \bar{x})^2} - \frac{m}{\sum (x_i - \bar{x})^2} \sum y_i x_i \right)^2 } \] |
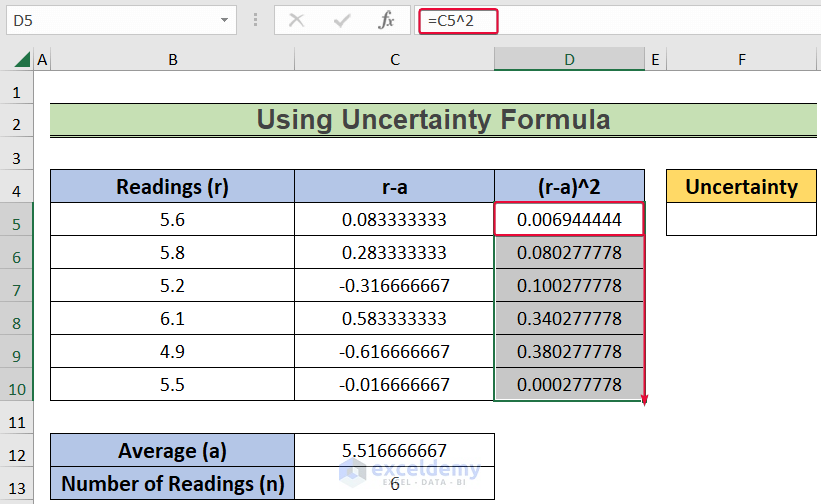
Where \Delta m is the uncertainty in the slope, m . This formula can be applied directly in Excel with cell references for each term.
5. Confidence Intervals
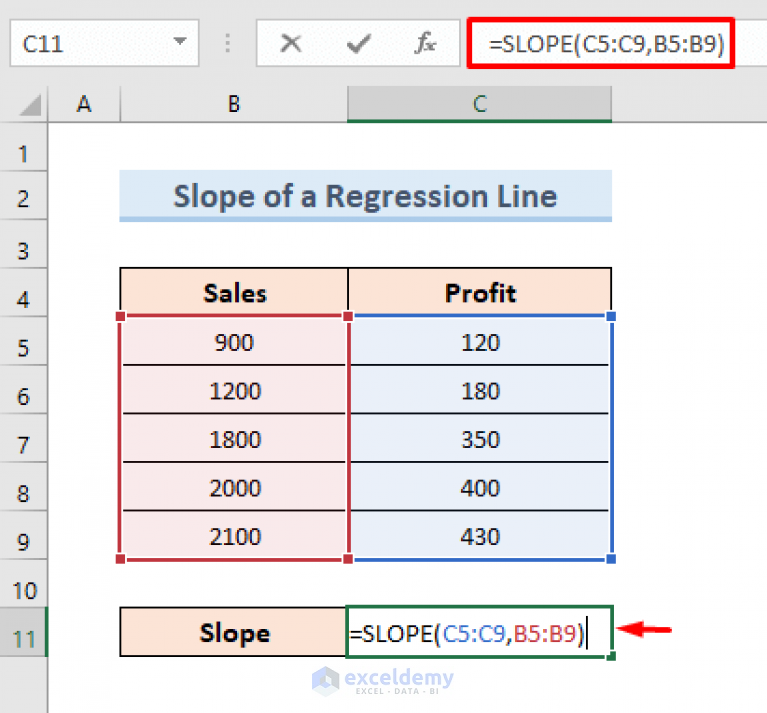
Constructing confidence intervals for the slope provides another view on slope uncertainty. Excel’s regression tools allow for the computation of confidence intervals:
- Use the LINEST function again but this time set the 4th argument to TRUE to get the confidence levels of the parameters.
- The returned array will include the standard error in the second row, which can be used to calculate confidence intervals using the t-distribution.
=LINEST(y_range, x_range, TRUE, TRUE)
The final element in the second row represents the 95% confidence interval for the slope. To convert this to actual confidence interval limits:
=Slope ± (T.INV.2T(0.05, Degrees_of_Freedom) * Standard_Error_of_Slope)
In summary, these five methods offer different approaches to quantify the uncertainty in the slope of a linear regression line:
- The LINEST function for a direct calculation.
- Bootstrapping for a robust, non-parametric method.
- Monte Carlo simulations for a simulation-based approach.
- Error propagation for considering individual measurement errors.
- Confidence intervals to understand the statistical significance of the slope.
Understanding the nuances of these methods allows you to select the one best suited to your data and the context of your analysis. Each method has its strengths, depending on the nature of your data and the specific requirements of your study or project.
Lastly, integrating these analyses into Excel not only simplifies statistical computations but also fosters a deeper understanding of statistical concepts through practical application. Whether you're in academia or industry, mastering these techniques in Excel can significantly enhance your data analysis capabilities.
What is the purpose of calculating slope uncertainty?
+
Slope uncertainty helps in understanding the reliability of the regression model by quantifying how much the estimated slope might vary due to sampling error or other factors.
Can these methods be used for non-linear regression?
+
While these methods are tailored for linear regression, with adjustments, some can be applied to non-linear models. For instance, bootstrapping can be generalized for any type of regression.
Which method should I choose for smaller datasets?
+
For smaller datasets, you might lean towards simpler methods like the standard error from LINEST or confidence intervals due to less computational complexity.
